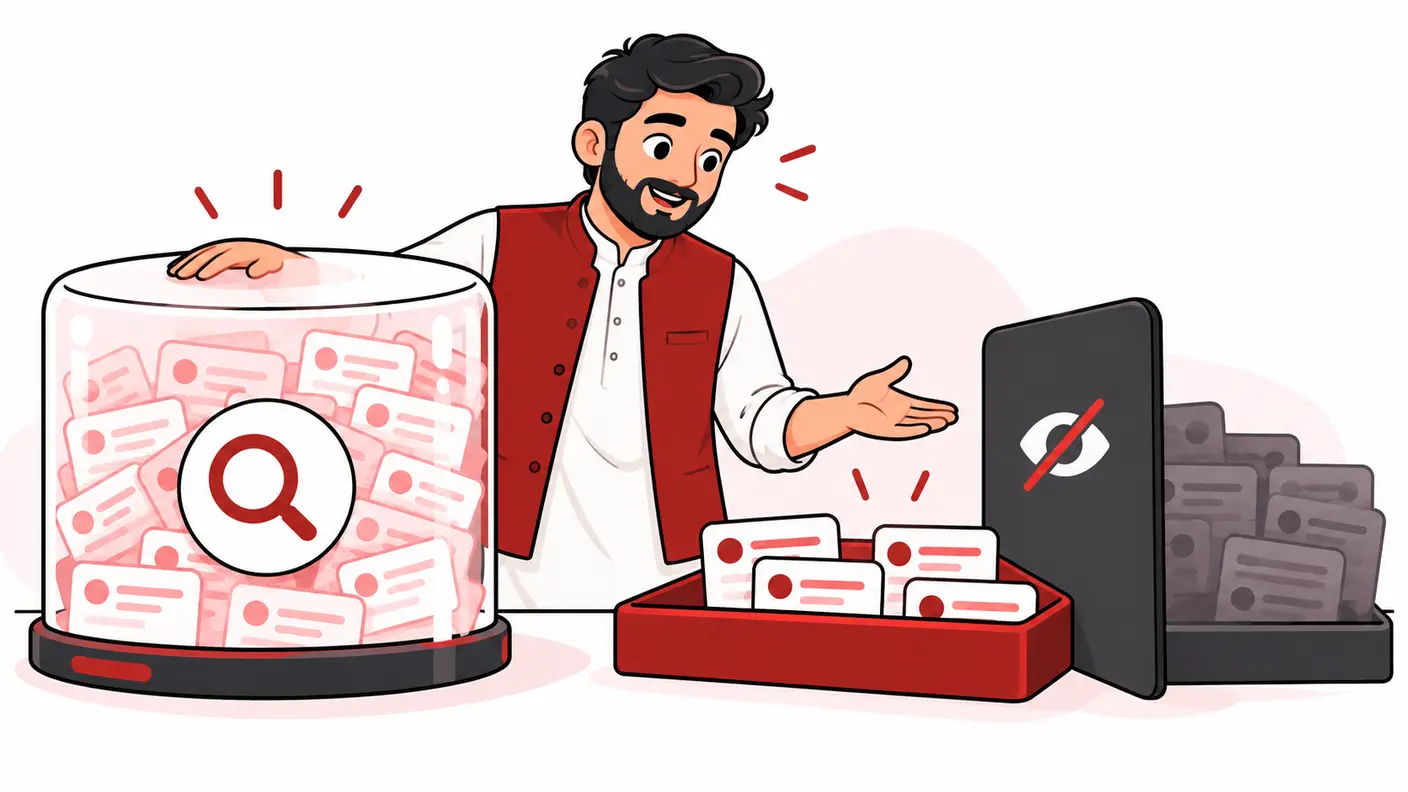
Search Console's visible query rows do not always add up to its chart totals. Check query privacy omissions, row limits, filters and aggregation before assuming that traffic is missing. A gap between two views is a reporting question first, not evidence that your website lost visits or needs a tracking-code repair.
This guide helps freelancers reconcile the scope of a client report and explain what the visible queries can support. It includes a worked coverage example and a reporting note that preserves uncertainty instead of assigning hidden searches to a convenient category.
Define exactly which two numbers disagree
Start with a sentence such as: “The clicks shown in the Search results chart exceed the sum of clicks in the exported query rows for this period.” That is specific enough to investigate. “Search Console is wrong” is not.
Record whether you are comparing clicks, impressions, CTR or position. Counts can sometimes be summed within an appropriate scope; ratios and averages need their own weighting. Do not add CTR percentages or average-position values across query rows and compare the result with a chart.
Keep Search Console clicks separate from analytics sessions. The GA4 and Search Console KPI guide addresses their broader reporting roles. This article focuses on differences within the Search Console report itself.
What Google's documentation establishes
Google's discrepancy guidance, reviewed October 19, 2026, lists aggregation differences, a 1,000-row table limit and anonymized query omissions as reasons chart and table totals differ. Anonymized queries are omitted from the query table but included in chart totals unless a query filter is applied. Matching and non-matching filter totals need not reconstruct an unfiltered total.
Its aggregation documentation distinguishes property-level counting from page-level counting. Comparing views with different aggregation can change the meaning of clicks, impressions and position.
The worksheet and numerical example below are editorial analysis, not an export from a real property. No missing search terms were recovered or inferred for this guide.
Step 1: create a scope record
| Field | Record before comparing |
|---|---|
| Property | Exact Domain or URL-prefix property |
| Report and search type | The same Search results context |
| Date range | Exact start and end, including whether recent data is complete |
| Filters | Page, query, country, device and appearance filters |
| Dimension | Queries, pages or another grouping |
| Metric | Clicks, impressions or a correctly interpreted ratio |
| Extraction | What was exported, when and with what visible coverage |
For a Pakistani agency reporting across international clients, record the actual property and market rather than relying on a familiar client name. A country-filtered screenshot and a global export do not answer the same question.
If the discrepancy disappears after aligning the scope, document the cause. Do not proceed to a privacy explanation simply because it sounds more technical.
Step 2: distinguish an incomplete table from missing business activity
Review how many rows are represented in the table or export and what filters were applied. The data you can inspect is not necessarily a complete list of every underlying search.
Do not multiply a few visible rows to estimate the rest without a defensible method. A long tail of small queries need not resemble the head terms, and the omitted terms cannot be reconstructed from a gap alone.
Preserve separate labels for total reported clicks, visible-query clicks and unrepresented clicks under the comparison's stated assumptions. Calling all three “organic traffic” can hide the very limitation you are trying to explain.
Step 3: check query-filter effects before calculating shares
If you filter for brand terms and then for terms not matching the brand, do not assume those two filtered chart totals must exactly equal the original unfiltered chart. The documented query-privacy behavior changes the comparison.
Build your classification on a reproducible rule and state its coverage. List the actual brand spellings, exclusions and ambiguous terms used in the analysis. Do not classify a generic word as branded merely because the business also uses it in its name.
Use “share among classified visible queries” when that is what you calculated. Reserve broader labels for evidence that actually supports them.
A worked example: a misleading brand-share percentage
Imagine a hypothetical report with 1,000 chart clicks. Under an aligned comparison, its represented query rows account for 700 clicks: 400 classified as brand and 300 classified as non-brand. The remaining 300 clicks are not represented in that query analysis.
| Component | Illustrative clicks | Defensible description |
|---|---|---|
| Chart total | 1,000 | Reported total under the recorded scope |
| Visible brand rows | 400 | Classified represented clicks |
| Visible non-brand rows | 300 | Classified represented clicks |
| Unrepresented remainder | 300 | Not assigned to either category by this analysis |
The visible-query brand share is 400 ÷ 700, or approximately 57.1%. That is not automatically the brand share of all 1,000 chart clicks. Coverage is 700 ÷ 1,000, or 70%, under these illustrative aligned-count assumptions.
Do not label the remainder “non-brand” to produce a more impressive discovery story, or “brand” to support a reputation campaign. Its classification is unknown.
For intuition only, if all unrepresented clicks could belong to either class and the stated counts are genuinely comparable, brand clicks could range from 400 to 700. That produces a very broad 40% to 70% mathematical range. It is not a Google-provided estimate and should not replace the honest visible-query label.
Step 4: avoid turning a remainder into a diagnosis
The difference between a chart and your extracted rows does not prove exactly how much was omitted for privacy versus other extraction or reporting reasons. Use the official explanations as possibilities to check, not a precise allocation formula.
If you cannot establish comparable scope, do not calculate a coverage ratio as though it were validated. Record the mismatch and resolve it first. An attractive percentage based on unlike denominators is not information gain.
Likewise, a query-table gap does not demonstrate a tag installation problem. Verify an actual collection issue separately if other evidence suggests one, rather than changing WordPress tracking because a search report's views are non-additive.
Step 5: compare periods fairly
When comparing brand and non-brand analysis over time, keep the classification rule and reporting scope stable. Show represented clicks and coverage for each period, not only the percentage that makes the trend appear strongest.
If one period has materially different represented coverage, discuss that limitation. The apparent change in classified share may combine a real demand change with a changed observable mix. Do not claim the cause from the percentages alone.
Use the same business question across both periods. A global unfiltered month and a country-specific month may be individually useful, but they do not create a fair trend comparison merely because both contain thirty days.
Step 6: write the client explanation
A useful note is: “The chart and query table have different coverage. Our brand analysis describes the visible classified query rows, which represent the stated share of chart clicks under the recorded scope. We have not assigned the unrepresented remainder to brand or non-brand.”
Then state the decision the analysis can support. For example, visible non-brand queries may reveal useful content questions, even though the list is incomplete. Incomplete evidence can still be useful if its limits remain visible.
Avoid saying “Google lost 300 clicks” or “we recovered hidden keywords.” Neither follows from the hypothetical example.
Create a reconciliation checklist
- The property, report, dates and search type are recorded.
- All filters and grouping differences are identified.
- The metric is a count or is weighted appropriately.
- The extracted row coverage is described honestly.
- Query privacy and filtering behavior are considered.
- Brand classification is documented and reproducible.
- The unrepresented remainder remains unclassified.
- The client conclusion does not exceed the evidence.
Keep this with the report's methodology rather than repeating a long technical disclaimer on every slide. A short visible limitation and an accessible detailed note are often enough.
Common mistakes and troubleshooting
Brand plus non-brand does not equal the total
Review query-filter behavior, data coverage and ambiguous terms. Do not force equality by changing the category labels or assigning the remainder without evidence.
A spreadsheet reports a different CTR
Check its numerator and denominator. Summing clicks and impressions within a valid comparable set is different from averaging row-level percentages equally.
The page table has different totals from the property chart
Review the aggregation definition before treating the difference as a missing-data error. The comparison may involve different units.
The latest export differs from yesterday's
Record extraction timing and whether the selected period was complete. Do not mix a changing recent interval with a finalized historical comparison without explaining that choice.
A tool claims to reveal every hidden query
Ask what dataset it actually uses and what it estimates. An external keyword suggestion is not evidence that a privacy-omitted Search Console query has been recovered.
Frequently asked questions
Is every chart-table mismatch a bug?
No. The official documentation describes expected reasons. Establish scope and coverage before escalating a suspected defect.
Can I publish the visible-query share?
Yes, if the classification and denominator are clear. Do not relabel it as complete-property share when your evidence is narrower.
Should I repair website tags to make these totals agree?
Not on this evidence alone. A difference between search-report views does not establish a website-tag fault.
Can a small site still use query research?
Yes. Treat the visible queries as useful but incomplete evidence, and avoid precise whole-site conclusions from a small represented set.
Conclusion
Align the scope, understand what each view counts and preserve the unknown remainder. A transparent coverage note makes query analysis more useful than a forced reconciliation. The objective is an accurate decision—not a spreadsheet whose totals agree only because uncertainty was hidden.
Need help applying this?
Get a practical review focused on the issue, evidence and next actions.
Contact Shahzaib