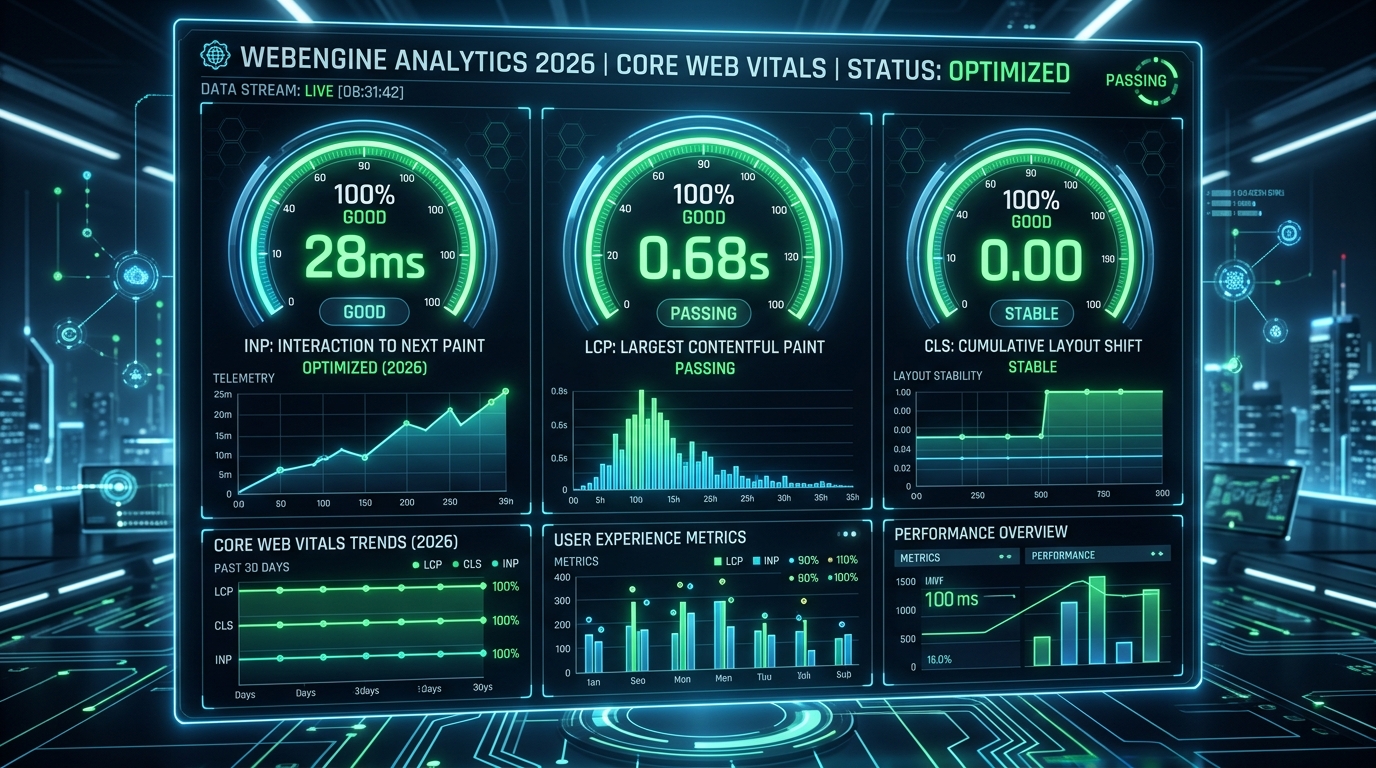
Page experience stopped being a “nice to have” a long time ago. In 2026, Core Web Vitals are woven into how Google’s ranking systems assess pages, and, more importantly, they measure exactly what separates a site that converts from one that bleeds visitors before the first paragraph even loads. A slow, jumpy, unresponsive page doesn’t just annoy people; it costs money. Every additional second of load time chips away at conversion rate, and every unexpected layout shift is a chance for a user to tap the wrong thing, get frustrated, and leave. Google has been explicit for years that page experience signals, including Core Web Vitals, are a tiebreaker among otherwise similarly relevant results: and for competitive queries, ties happen constantly. If your content and your competitor’s content are both solid, the site that loads faster and feels more stable wins the click and, increasingly, the ranking.
This guide walks through the three Core Web Vitals as they stand in 2026 (Largest Contentful Paint (LCP), Interaction to Next Paint (INP), and Cumulative Layout Shift (CLS)) with current thresholds, the real-world causes behind bad scores, and the fixes that actually move the needle. INP has been a full Core Web Vital since March 2024, replacing First Input Delay (FID), and it remains the metric most sites still fail today.
What Core Web Vitals Are and Why Google Uses Them
Core Web Vitals are a subset of Google’s broader “page experience” signals, focused specifically on three measurable aspects of how a page feels to use: how fast the main content appears (LCP), how quickly the page responds to interaction (INP), and how visually stable it is while loading (CLS). They were introduced because traditional performance metrics (like Time to First Byte or fully-loaded time) don’t actually correlate well with how a human perceives a page. A page can finish “loading” technically while still feeling slow, janky, or unpredictable to the person using it.
Google uses Core Web Vitals because they’re derived from real Chrome user data at scale (the Chrome User Experience Report, or CrUX) rather than synthetic benchmarks alone, and because they’re measurable, comparable across the entire web, and directly tied to user-perceived quality. They’re one of many ranking factors, and content relevance and quality still dominate: but Google has repeatedly confirmed that page experience acts as part of the overall ranking evaluation, especially when comparing pages of similar topical relevance. On top of the direct ranking angle, Core Web Vitals correlate strongly with bounce rate, session duration, and conversion rate, so treating them purely as an “SEO checkbox” undersells the business case.
Each metric is scored against three bands: Good, Needs Improvement, and Poor. Google evaluates a page (or origin) at the 75th percentile of real-world visits, meaning at least 75% of your traffic needs a “good” experience for that page or URL group to be classified as passing. This p75 threshold matters because it prevents a handful of fast repeat visits (with everything cached) from masking a poor first-time experience.
LCP, Largest Contentful Paint
LCP measures loading performance: specifically, the render time of the largest image, video, or block-level text element visible within the viewport, relative to when the page first started loading. It’s meant to approximate the moment a user feels like “the page is basically here.”
Current thresholds (measured in seconds, at p75):
- Good: 2.5 seconds or less
- Needs Improvement: between 2.5 and 4.0 seconds
- Poor: more than 4.0 seconds
Common causes of poor LCP
- Slow server response times (high Time to First Byte): often from unoptimized hosting, no caching layer, or heavy server-side rendering without caching.
- Render-blocking CSS and JavaScript that delay the browser from painting anything.
- Large, unoptimized hero images or above-the-fold background images served without modern compression.
- Client-side rendering frameworks that fetch data after initial page load, delaying the “largest” element from appearing until JS executes and data arrives.
- Slow, uncached third-party resources loaded ahead of the main content (fonts, ad scripts, tag managers).
- Missing preconnect/preload hints, forcing the browser to discover critical resources late.
Practical fixes
- Put a CDN in front of your site and cache HTML at the edge where possible; this alone often cuts TTFB dramatically for global audiences.
- Compress and serve responsive images in modern formats (WebP or AVIF) with correctly sized srcset variants, so mobile users aren’t downloading a 2400px-wide hero image.
- Preload the LCP resource explicitly with
<link rel="preload" as="image">for hero images, and usefetchpriority="high"on the LCP element. - Never lazy-load the LCP image itself, lazy-loading is for below-the-fold content; applying
loading="lazy"to your hero image is one of the most common self-inflicted LCP regressions. - Inline critical CSS for above-the-fold content and defer non-critical stylesheets.
- Move to server-side rendering or static generation for content-heavy pages instead of pure client-side rendering, or at minimum render the LCP element server-side even in a hybrid app.
- Use
font-display: swap(oroptional) so custom web fonts don’t block text rendering, and preload key font files. - Audit and trim third-party scripts that execute before first paint; load analytics and marketing tags asynchronously or defer them until after the main thread is idle.
INP, Interaction to Next Paint
INP measures overall responsiveness: it observes all click, tap, and key interactions during a page’s lifespan and reports a representative “worst-ish” value (technically, the high percentile of interaction latencies, effectively ignoring the single worst outlier on high-interaction pages) (the time from when a user interacts with the page to when the browser is next able to paint the resulting visual update. Unlike its predecessor FID, which only measured input delay (the wait before processing even started), INP captures the full interaction: input delay, processing time, and presentation delay. That full-picture approach is exactly why INP replaced FID as a Core Web Vital in March 2024) FID could look great on a page that was actually janky to use, because it ignored what happened after the browser started handling the click.
Current thresholds (measured in milliseconds, at p75):
- Good: 200 milliseconds or less
- Needs Improvement: between 200 and 500 milliseconds
- Poor: more than 500 milliseconds
INP is, as of 2026, the metric most sites still fail: heavy client-side interactivity, bloated JavaScript bundles, and complex single-page apps make it structurally harder to pass than LCP or CLS.
Common causes of poor INP
- Long JavaScript tasks that block the main thread, so the browser can’t respond to input until the task finishes.
- Large JS bundles that take a long time to parse and execute, especially on mid-range mobile devices with much weaker CPUs than the developer’s machine.
- Expensive event handlers doing synchronous work (large state updates, unoptimized re-renders in React/Vue, layout thrashing by reading and writing DOM properties in a loop).
- Third-party scripts (chat widgets, ad networks, analytics, A/B testing tools) that inject their own long tasks unpredictably.
- Overly complex CSS selectors and huge DOM trees that make style recalculation and layout expensive on every interaction.
Practical fixes
- Break up long tasks using techniques like
scheduler.yield(),setTimeout(fn, 0), orisInputPending()so the main thread can breathe between chunks of work and handle input sooner. - Reduce total JavaScript shipped: code-split by route, defer non-critical bundles, and audit dependencies for dead weight (a surprising amount of INP damage comes from libraries loaded but barely used).
- Debounce or throttle expensive handlers (scroll, resize, input) and move non-urgent work (analytics beacons, logging) off the critical interaction path using
requestIdleCallbackor by queuing it after the paint. - Memoize and virtualize heavy UI updates in frameworks, avoid full-tree re-renders when only a small part of the UI actually changed.
- Audit third-party tags with something like the Total Blocking Time breakdown in Lighthouse or Chrome DevTools’ Performance panel, and lazy-load or sandbox the worst offenders (e.g., load a chat widget only after user interaction or a delay).
- Use web workers to move non-UI computation (parsing, sorting, heavy calculations) off the main thread entirely.
CLS, Cumulative Layout Shift
CLS measures visual stability by summing the “impact” of unexpected layout shifts that occur during the page’s lifespan, each shift’s score is a product of how much visible content moved (the impact fraction) and how far it moved (the distance fraction). Shifts triggered within 500ms of a user interaction are excluded, since intentional content changes shouldn’t be penalized.
Current thresholds (unitless score, at p75):
- Good: 0.1 or less
- Needs Improvement: between 0.1 and 0.25
- Poor: more than 0.25
Common causes of poor CLS
- Images, embeds, and iframes without explicit
widthandheightattributes (or an aspect-ratio reserved via CSS), so the browser doesn’t know how much space to allocate before the asset loads. - Ads, embeds, or third-party widgets injected dynamically without a reserved placeholder, causing content to jump when they finally load.
- Web fonts that swap in with different metrics than the fallback font, a big cause of reflow often called FOIT/FOUT-related shift.
- Content (banners, cookie notices, promotional bars) injected above existing content after the initial render.
- Actions that trigger layout changes without user interaction, such as content loading asynchronously and pushing everything below it down.
Practical fixes
- Always set explicit width/height (or
aspect-ratioin CSS) on images, video embeds, and iframes, so browsers reserve the correct box before the asset arrives. - Reserve fixed space for ad slots and third-party embeds up front, matching the maximum expected size, rather than letting the container grow once content loads.
- Use
font-display: swapalongside size-adjust properties or a matched fallback font (viasize-adjust,ascent-override, etc.) to minimize the visual jump between fallback and web font. - Avoid inserting new content above existing content unless it’s in direct response to a user action (e.g., don’t drop a promo banner above the fold two seconds after load).
- Animate layout changes using CSS
transforminstead of properties that trigger reflow (top,left,width,height), since transform-based animations don’t count against CLS. - Test cookie consent banners and sticky headers carefully: these are frequent, easily-missed CLS culprits, especially on mobile where viewport space is tight.
How to Measure Core Web Vitals
No single tool tells the whole story, you need a combination of field and lab tools to both understand real-world scores and be able to debug and iterate quickly.
- PageSpeed Insights (PSI): The most accessible starting point. It shows both field data (from CrUX, if the URL or origin has enough traffic) and a fresh lab-based Lighthouse audit, with concrete, prioritized recommendations for that specific page.
- Search Console Core Web Vitals report: Shows how groups of similar URLs on your entire site perform in the field over time, bucketed by Good/Needs Improvement/Poor, so you can see whether a template-wide issue (e.g., every product page) is dragging down your scores rather than a single URL.
- Chrome UX Report (CrUX): The underlying real-user dataset that powers PSI’s field data and Search Console; you can also query it directly via BigQuery or the CrUX API for bulk analysis, historical trends, or comparing against competitors.
- Lighthouse: A lab-based auditing tool (built into Chrome DevTools, or runnable via CLI/CI) that simulates a page load under controlled network and CPU conditions, producing a reproducible score and detailed diagnostics, ideal for local development and regression testing before you ship changes.
- web-vitals JS library: Google’s official library for capturing real Core Web Vitals data directly from actual visitors in production, which you can send to your own analytics platform (GA4, a data warehouse, or a custom dashboard). This is essential if you want granular, real-time visibility rather than waiting for CrUX’s 28-day rolling window.
Field Data vs. Lab Data
These are not interchangeable, and conflating them is one of the most common mistakes in Core Web Vitals work. Field data (from CrUX, PSI’s “field data” section, Search Console, or the web-vitals library) reflects what real users on real devices and real network conditions actually experienced (it’s the data Google’s ranking systems reference, and it’s inherently noisy and delayed (CrUX typically reports a trailing 28-day aggregate). Lab data (from Lighthouse or WebPageTest) is generated under fixed, repeatable conditions on a single simulated device and connection profile) great for debugging and catching regressions in CI, but it can diverge meaningfully from field results, especially for INP, since lab tools can’t easily simulate the messy, varied ways real users actually interact with a page.
The practical takeaway: use lab tools during development to catch problems before you ship and to verify a fix worked, but treat field data as the source of truth for whether you’ve actually solved the problem for real users, and expect a lag of several weeks before a fix is fully reflected in Search Console and CrUX.
A Prioritized Action Plan
If you’re starting from scratch or triaging a site with multiple failing metrics, work in this order:
- Fix CLS first: it’s usually the cheapest to resolve (dimension attributes, reserved ad space, font-display tuning) and gives quick, visible wins with low regression risk.
- Tackle LCP next: audit your hero image delivery, enable a CDN and proper caching headers, preload the LCP resource, and eliminate render-blocking resources above the fold.
- Address INP last, since it’s usually the most involved: profile long tasks in DevTools’ Performance panel, break up JavaScript execution, defer or sandbox third-party scripts, and reduce hydration/re-render cost in your framework of choice.
- Set up continuous monitoring: wire the web-vitals library into your analytics so regressions are caught within days, not months, and add Lighthouse CI checks to your build pipeline so a bad deploy can’t quietly tank your scores.
- Re-test after every meaningful change using both lab tools (to confirm the fix technically works) and field data over the following weeks (to confirm real users actually experience the improvement).
Conclusion: Performance Is a Ranking and Revenue Lever
Core Web Vitals aren’t a box-ticking exercise bolted onto SEO (they’re a genuine measure of whether your site respects the person using it. LCP tells you whether content shows up fast enough to keep someone from bouncing, INP tells you whether the page actually listens when someone taps or types, and CLS tells you whether the layout can be trusted not to jump around and cause a mis-click. Passing all three at the 75th percentile, in the “Good” band, won’t single-handedly out-rank a page with thin or irrelevant content) but for pages competing on genuinely similar quality and relevance, it’s often the difference that tips a ranking, and it consistently correlates with lower bounce rates and better conversion. Treat performance work the way you’d treat any other ongoing optimization: measure with both field and lab data, fix the cheapest wins first, and keep monitoring so today’s good score doesn’t quietly regress after your next redesign or plugin update.
Related
Want this checked on your own site?
A 20 minute review, no obligation. I will tell you honestly which of this actually applies to you and which does not.
Written by Shahzaib Ul Hassan, senior AI SEO consultant and founder of ShazzSEO. Ranking sites since 2009.
If the numbers still will not move after all this, the bottleneck is usually one thing rather than ten. That is what a Core Web Vitals fix is scoped to find.